Archive for December, 2012

Use SQLite Virtual Tables to Connect to Shapefiles

Your data is in a shapefile and you want to run some spatial queries but don’t want to load your data into PostGIS or some other spatial database, what do you do?  You can use SQLite’s virtual tables to create a quick link to your data, and here’s how.

  • First, from the directory your shapefile is in start sqlite3.
  • Next, use SELECT load_extension(‘libspatialite.so’); to enable the spatialite extension.
  • Load your shapefile as a virtual table with:
CREATE VIRTUAL TABLE <table_name> 
USING VirtualShape(<shapefile_name>, 'UTF-8', );

Now you can run any read-only spatial query you want against your new table.  Note, the ‘UTF-8’ value will need to be changed if your shapefile isn’t using Unicode encoding.
Ranking the Indiana Breweries by Population

In my last post I used PostGIS to calculate the number of Hoosiers that live within 5 miles of an Indiana microbrewery.  Now I want to rank each brewery by population.  The total is going to be a little more than the 2.5 million-ish I came up in the last post due to the lucky duckies who live with 5 miles of more than one brewery.

Flat 12 of Indianapolis, with over 243,000 people within 5 miles of their location is our winner.  No big surprise, but the top 11, and 12 of the top 13 are all Indy breweries.

A few breweries, most notably Three Floyds in Munster are lower than they should be because I only used Indiana census data.  Three Floyds is only a half mile from the Indiana / Illinois border.  If I included Illinois data the nearby Chicago population would have pushed them up the list.

The full list and the SQL used to create it are below the jump.

Continue reading

How many Hoosiers live with 5 miles of an Indiana brewery?

2,539,798.  Approximately.  I think.  Maybe.  Here’s what I did to get there.

First, the Census department has put together some nice pre-digested block layers, they include the total population for the blocks so you don’t have to compile that data yourself.

Second, create a 5 mile (acutally I used 8046.72 meters because my data in a UTM projection) buffer around my brewery points.  Shp2pgsql, use it to shove the buffers into a PostGIS database and call the layer buffer_5mile.  Fun!

Third, load the block data into QGIS and add a numeric field (I used totarea) to store the area of the blocks.  Use shp2pgsql to reproject the census data to match your buffers and load the results into PostGIS.  I called my layer block_pop.

Fourth, update that new area field with

UPDATE block_pop SET totarea = st_area(geom);

Fifth, to get an estimate of the population within the buffers use:

SELECT 
round(sum(c.pop10*(ST_Area(ST_Intersection(c.geom, b.the_geom))) / c.totarea)) 
FROM
(SELECT ST_Union(geom) as the_geom FROM buffer_5mile) as b, block_pop c
WHERE ST_Intersects(the_geom, c.geom);

Bam.  You done.

Early impressions of QGIS 1.9

I had a raster and I needed to make the no data value transparent, but QGIS 1.8 has a bug that prevented me from doing so.  Since I’m not working in a production environment I decided to go ahead and pull 1.9 from QGIS’s Git repository and give it a shot.  Someone has set up a PKGBUILD that handles all the hard work of pulling the latest and greatest off of github for you.

Once 1.9 was downloaded and compiled I really liked what I saw.  Not only is the no data transparency bug fixed, but the raster menu is completely overhauled.  I will miss the old single band pseudo-color and freak out settings, I guess I can figure out what their color ramps were and rebuild them by hand.  I’ll take that over the old way rasters were handled which left you staring at a grey box until you set the min/max values and stretched the display to their values.  Now when you load a raster you get a usable display right off the bat.

Also new in 1.9 is the updated label tab and engine.  I haven’t played with it much but there are a million options to play with, once you dig into it labels are going to rival what you get from ArcMap’s Maplex label engine.

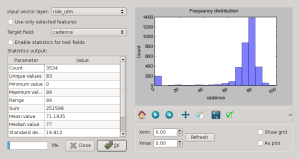
I also downloaded a new plugin, Statist.  It is available from the official plugin repository, and it works on QGIS 1.8 or greater.  This plugin is similar to ArcMap’s Statistics menu, as you can see in the screenshot below it gives you a frequency chart and a break down on some basic statistical data from fields in your vector layers.  Simple, easy to use, and gives you valuable information, it’s a great plugin.  Before you can use it you’ll need to install a python 2 library, python2-matplotlib.  For Arch users this library is available from the community repository.

statist plugin screenshot

Proof that I don’t pedal fast enough


R Graphics Device is blank, won’t show plots or charts

Arch‘s latest version of R (2.15.2-1) has a bug, nothing is drawn when you send a plot or chart to the default graphics device.  It’s an easy fix, before you plot anything issue the following command:

X11(type="Xlib")

After that you’re good until you close that Graphic Device.  If you close it you’ll have to re-issue the command.  There’s an entry for this issue in the bug tracker, hopefully this issue will be resolved soon.