Posts Tagged ‘ QGIS ’

Updated Indiana Breweries Map

A few months ago I followed Darren Cope’s Geography of Tim Horton’s blog post to create a similar map that showed breweries in Indiana.  A new brewery opened up down south so I decided to update the map.

To get the location I looked up the location on Google Maps then used the QGIS plugin OpenLayers to find the brewery on Google Maps’ Hybrid Map.  I added the point to my breweries PostGIS layer and re-imported the layer into GRASS along with a shapefile of the state.  From there I used v.to.rast.constant to convert those layers to rasters.

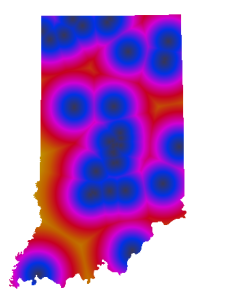
With the vectors converted to rasters I used r.mask to use the Indiana raster as a mask for the next step which is to use r.grow.distance to create the final map.  The result was exported with r.out.png and brought into GIMP to make the no data areas transparent.

To create the transparencies use Layer -> Transparency -> Add Alpha Channel then use the Select Region by Color tool to select the no data areas, then press the delete key to zap them away.  The image below is the result.


Location of breweries in Indiana

Indiana breweries

You need ArcInfo for this? Seriously?

I had two line layers and needed to create points at where the layers intersected.  In QGIS this is done with the line intersection tool found in the Vector -> Analysis Tools menu.  Just give it the two input layers, name an output layer and you’re done.  As near as I can tell with ESRI tools you have to spring for ArcInfo so you can use the Feature to Lines tool as specified in this Ask the Cartographer post.

Watch your projections when using QGIS’s raster clipper

I needed to clip a county-wide Mr. Sid file down to just the area of interest for a project.  QGIS‘s raster clipper tool, a front end for gdal_translate, made that easy.  You can either clip by a selected extent, or by a masking polygon from a vector layer.  I did run into one problem, the project’s CRS was the local State Plane projection and the source raster was in UTM.  Gdal_translate returned the following error:

Computed -srcwin falls outside raster size of 28249x42326

Resetting QGIS’s project CRS to match the raster’s projection fixed the error.

Views, PostGIS 2, and QGIS

If you wanted to create a view with spatial capabilities with previous versions of PostGIS all you needed to do was manually register the view in the geometry_columns table.  This is no longer possible since from PostGIS 2.0 forward geometry_columns is a view, not a table.  However, if you use typemods to define the geometry column your view the geometry_columns view will pick it up.  For example, I wanted to take some of the data I loaded from my .fit files and convert the metric data to imperial units, and reproject the data from WGS84 to UTM.   Here’s the view that does that for me:

CREATE OR REPLACE VIEW rides.ride_utm AS
SELECT id, no
, utility.units_from_to('meter', 'feet', altitude) AS edge_elev
, 32+(temperature*(1.8)) AS temp_f, speed*2.2369 AS mph, cadence
, ride_date, ride_time, elev_dem
, ST_Transform(the_geom, 26916)::geometry(Point, 26916) As the_geom FROM rides.ride;

The units_from_to function is something I picked up from PostGIS in Action.  The geometry column uses ST_Transform to reproject the data, and the typemod after defines the column as having point geometry with my UTM projection.

With the geometry column defined in that manner the geometry_columns view is properly populated.  When you want to use this view in QGIS it is visible as a loadable layer.  However, before you can use it you must tell QGIS which field is the unique row identifier.  To the left of the layer’s SRID number there will be a drop box on the PostGIS layer load screen.  This dropbox will give you a list of possible fields to use as your ID column.  Just select the column that contains unique values and you’re good to go.

Adding elevation data to a point layer from a DEM

I’ve put together a Python script that uses pyqgis to add elevation data from a DEM to the attribute table of a point layer.  I’m going to use it to compare the elevations recorded by my Edge 500 to elevations derived from local DEMs.  I pieced the script together with tons of help from the PyQGIS Cookbook.

Here’s what I came up with.  It requires both the point layer and DEM to be in the same projection.

Continue reading

Use QGIS to generate contour lines from a DEM

This guide will help those who have used ESRI software in the past to create countour line datasets.  Instead of spending big bucks on ArcDesktop and the Spatial Analyst you can do this for free with QGIS.

The first step is to load your DEM data.  QGIS uses GDAL to handle raster datasets, and GDAL can load almost every format out there.  Seriously, GDAL is awesome.  Once you have loaded your data make sure it is in the correct projection by right clicking the layer in the table of contents, the select Set Layer CRS.  You’ll also want to set the project to your layer’s CRS, you can either use the Set Project to Layer CRS in the same menu, or go to File, Project Properties, and click the Coordinate Reference System tab.

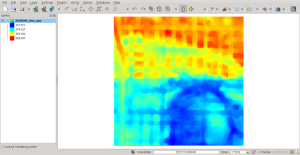
In other GIS software your DEM may automatically be drawn with a grayscale or colormap already set.  In QGIS by default you’ll only see a gray rectangle.

DEM Loaded

QGIS displaying a DEM with no colormap or grayscale stretching.

On the style tab of the layer properties menu you can select how you want your raster to be symbolized.  Here’s the same layer displayed with elevations represented by pseudocolors:

QGIS pseudocolors

DEM displayed with pseudocolors

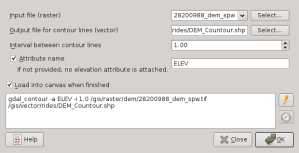
To generate contours click Raster, then Extraction, then select the Contour menu.

QGIS Contour menu

QGIS contour menu.

The menu is pretty self explanatory.  It is a front end for the gdal_contour command line tool.  You can use the generated command at the bottom as the starting point for a batch file if you have several files you need to convert.

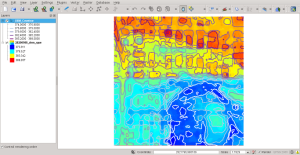
DEM with contours

Contour lines sitting on DEM they were created from

Easy peasy!

QGIS 1.8.0 in AUR

The PKGBUILD QGIS 1.8.0 is now in AUR.  The packager also put together a PKGBUILD for libspatialindex, calling it spatialindex so that QGIS wouldn’t have to go to a git repository to build a dependency.

This is great and all but hopefully QGIS makes it back into the official repositories, having the PKGBUILD out there is nice but QGIS takes FOREVER to compile from source.

Got QGIS 1.8 to compile on Arch

Finally got the new QGIS to compile and install.  Before starting you’ll need to install libspatialindex, for Arch users it is available from AUR from package libspatialindex-git.

The first time I tried to get it to compile it bombed out at 96%, it couldn’t find libqgis_core.so.1.8.0.  I couldn’t figure out how to get cmake to look in the build’s output directory to find the freshly built library so I cheated and copied the library to /usr/lib.  That worked and 1.8 started up just fine.

Playing around with 1.8 I found spatialite manager didn’t work, I was missing a python module called pyspatialite.  To install it just download and extract the tarball, in the pyspatialite-3.0.1 directory there’s a setup.py file.  Just run:

python2 build clean install

to install it.  Done, easy peasy.

Hopefully someone will post a PKGBUILD to AUR that will simplify this whole process.  In the meantime at least I’ve got 1.8 up and running.

QGIS 1.8!

QGIS 1.8 was released yesterday.   This release gives us QGIS Browser, a file manager for working with spatial datasets similar to ESRI’s ArcCatalog.  You can use it to browse and organize your spatial data, preview their geography, and drag and drop them into your maps.  Also new is DB Manager.  Previously available as a plugin, it has been refined and added to the main application itself.  With DB manager you can copy layers from one database to another, say from PostGIS to Spatialite, you can run ad hoc queries against a spatial database and add the results as a layer to your map. I’ve only scratched the surface of DB Manager’s capabilities.  Later I’ll run it head to head against the Fast SQL Layer and RT SQL Layer plugins.  But first I’ll have to get 1.8 to install on my Linux laptop.

I couldn’t get 1.8 to compile; I tried to modify the PGKBUILD from AUR for 1.7.4, but 1.8 couldn’t find my Spatialite libraries.  I didn’t have much time to troubleshoot, hopefully I can get it to work this weekend.  In the meantime I’m testing 1.8’s Windows build to get a feel for the new features.  There is good news on the Windows front, apparently a 64 bit binary is just around the corner.   Once they do they’ll be yet another desktop GIS to get 64 bit support before ESRI.

How far away are you from beer on a Sunday in Indiana?

Answer:  At most 50 miles.

Inspired by GIS blogger Darren Cope’s analysis of Tim Horton’s locations in Canada I decided to figure out how far you are at any given time from a microbrewery in Indiana.   Instead of Canadian coffee and donuts I mapped brewery locations.  I pulled the Brewer’s Guild of Indiana’s membership list (and took out Bee Creek, I’m pretty sure they’re closed).  This is a vital map because Indiana’s blue laws prohibit alcohol sales on Sundays except at microbreweries and vineyards.   Two things I don’t like on Sundays, wine and crossing state boundaries so this was a vital project for me.  I found that I really don’t want to be in northeast Dubois County on a Sunday. Seriously, 50 miles.  Dang.  At least people in Vincennes and Terre Haute can jump over to Illinois for a 6 pack.

Distances to Indiana breweries

I followed Cope’s steps except to get the lat / long for the breweries I had to geocode them against the TIGER street centerlines and instead of using GRASS directly I used QGIS’s GRASS plugin.  This article was a big help on getting a GRASS workspace set up to create the raster.